Analyze and Export
Once you have a view in the Metrics tab that answers an interesting question, you can export the underlying data and analyze it further — in a spreadsheet, a BI tool, or simply to share with a non-AI-Kit colleague.
Exporting
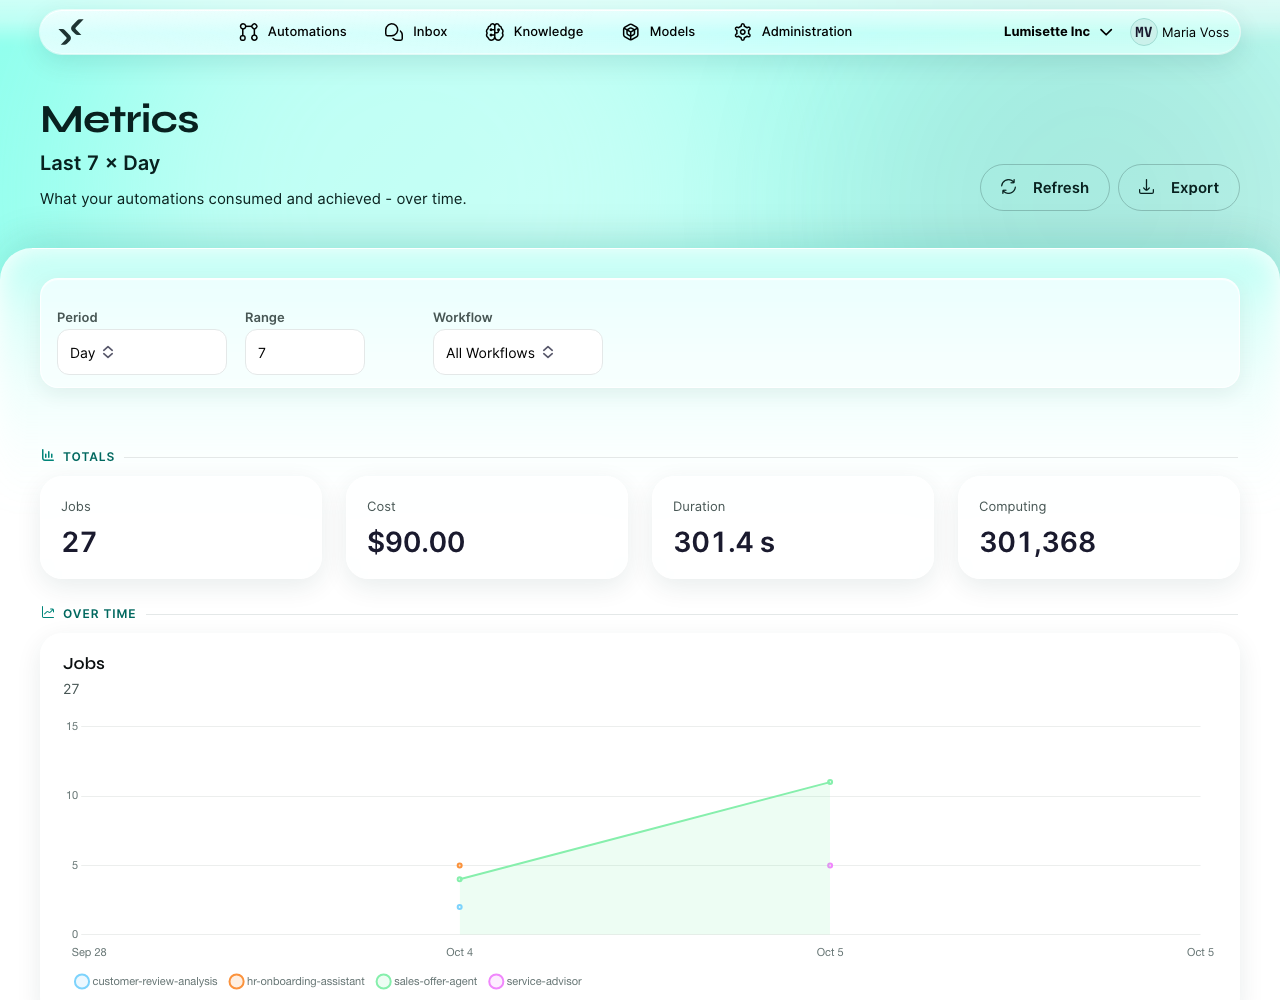
Click Export in the page toolbar. The button uses your current filters: same period, same range, same workflow filter. So the typical pattern is:
- Adjust the filters until the on-screen view matches what you want.
- Click Export.
- The platform downloads a file named
metriken_<workspace>_<workflow|alle>_<date>.csv.
The button stays disabled while there is nothing to export.
What you get
CSV with a header row, one row per (period, workflow) combination. The columns are exactly these, in this order:
| Column | Meaning |
|---|---|
period | Start of the bucket |
workflowId | The automation's ID |
jobs | Number of runs in that period |
tokens | Total tokens |
inputTokens / outputTokens | Split of the above |
tokenCost | Cost of those tokens |
inputCost / outputCost | Split of the above |
durationSeconds | Total run time |
durationCosts | Cost derived from run time |
manualCost | Manually recorded cost |
currency | Currency of all cost columns (the workspace currency) |
Values are quoted, so an automation name containing a comma does not break the row. The file starts with a byte-order mark, which is what makes Excel open umlauts correctly.
There is no success/failure column — the export is consumption data. Which runs failed you see in the jobs list of the automation itself.
Reporting patterns
Monthly cost report for finance
Period Month, range 12, All Workflows. Export. The result is one row per month per automation, which pivots nicely into a per-automation column chart or a summary table.
Operational load for ops review
Period Week, range 8, All Workflows. Export. Pivot jobs and
durationSeconds per automation to see which ones carry the load and which
ones got slower. For reliability — which runs failed — use the jobs list of
the automation, not this export.
Cost per business unit
If your automations follow a naming convention (e.g. "[Sales] Daily digest", "[HR] Vacation agent"), you can extract the bracketed prefix in your spreadsheet and group cost by business unit.
Combining with provider invoices
The provider invoice (OpenAI, Anthropic, Mistral) is the authoritative cost number. Reconciliation is a useful monthly hygiene exercise:
- Export Metrics for the month.
- Sum the
tokenCostcolumn (adddurationCostsif your workspace prices run time). - Compare to the provider invoice.
The two usually match within 1-3 %. Larger discrepancies typically have one of these causes:
- The provider's rate changed mid-month and the rate stored in the AI Kit is from before or after.
- An automation outside the AI Kit is hitting the same API key.
- The provider is billing for something that does not appear as tokens in the AI Kit's view (file uploads, fine-tuning, separate APIs).
Update the model rate or rotate keys as needed.
Tools that work well with the export
The CSV format is intentionally boring. It opens cleanly in:
- Excel and Google Sheets — for ad-hoc analysis and reports.
- Power BI and Tableau — for ongoing dashboards.
- Python (pandas) — for one-off analyses, anomaly detection, or merging with other data sources.
The platform does not provide a built-in BI tool. For most teams the export plus a spreadsheet is enough; for serious dashboarding, hook the export into your existing analytics pipeline.
Recommendations
- ✅ Set the filters first, then export. The export reflects exactly what is on the screen.
- ✅ Use monthly granularity for finance, weekly for ops, daily only for debugging.
- ✅ Reconcile with the provider invoice once a month. Small drift is fine; large drift is a signal.
- ⚠️ The export is a snapshot. Re-running an analysis a month later may show slightly different numbers because the underlying data may have been pruned.
- ❌ Do not use the export as an audit log. It is summary data; the per-job details live in the Jobs view of each automation.
What to do next
- Administration → Licensing — quotas, plans, upgrades.
- Models → BYOK — reconcile against provider invoices.