Configuration Health
The Server Info page is where you check that the AI Kit's own infrastructure is healthy. It is most useful for the team running the installation on-premise; cloud installations have these things monitored for them, but the page is still informative.
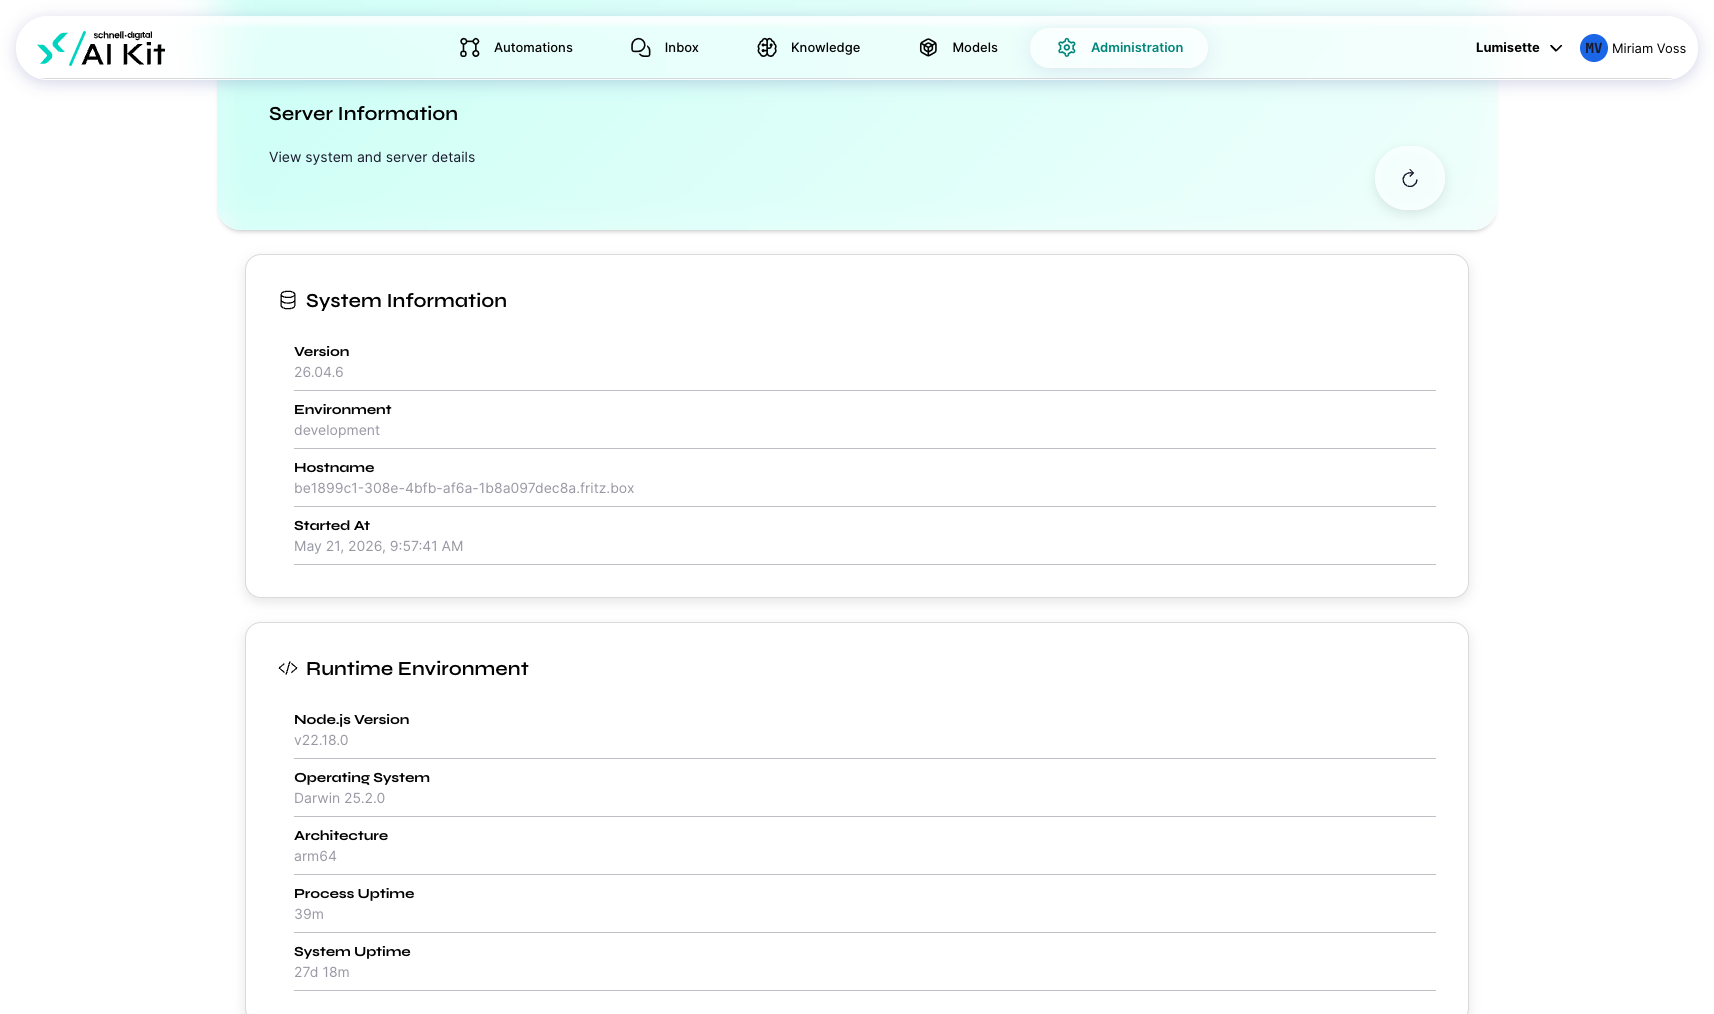
This page lives under Administration → Server Info.
What the page shows
| Field | What it tells you |
|---|---|
| Version | The AI Kit version running. Compare against the latest release when planning upgrades. |
| Build date / commit | Useful when working with support — pinpoints exactly which build is in use. |
| Environment | Production, staging, development. |
| Hostname | The server's name as it identifies itself. |
| Node version | The Node.js runtime the platform uses. |
| Process uptime | How long the AI Kit has been running since the last restart. |
| Memory | Current and peak memory usage. |
| CPU load | One-, five-, and fifteen-minute load averages. |
| Disk usage on the data volume | How full the storage area is. |
| Active jobs | How many jobs are currently running across all workspaces. |
| Queued jobs | How many are waiting for a worker. |
What to look for
Disk usage
The single most actionable metric. The data volume holds all configuration, all job history, all knowledge content. If it fills up, the AI Kit cannot write — and automations fail.
Recommended thresholds:
- Below 70 % — fine.
- 70 - 85 % — plan a cleanup or a volume expansion.
- Above 85 % — act now. Either expand the volume or prune old jobs.
The platform automatically archives finished jobs older than a configurable retention period. Agent jobs are not pruned by design (they are intended to be a permanent record). If your knowledge bases or agent history is what dominates the disk, consider archiving older agent jobs out-of-band.
Memory
Memory usage tends to be stable. Slowly rising memory across days is a sign of a leak — capture a screenshot and contact support.
CPU load
Sustained high load is usually one of:
- Concurrent large-model invocations on a CPU-bound self-hosted setup.
- A knowledge refresh on a very large knowledge.
- A burst of webhook triggers from an external system.
Short spikes are fine; sustained high load suggests it is time to give the server more headroom.
Active and queued jobs
A growing queue means jobs come in faster than they complete. Common causes:
- An external API is slow.
- A new automation was activated that fires too often.
- A trigger is mis-configured (for example a cron of
* * * * *).
The Trigger Monitor (see below) helps pinpoint which trigger is responsible.
When to refresh the page
The information is point-in-time. Click Refresh to fetch the latest values. The page does not auto-refresh — by design, since polling a server status page is itself work.
Recommendations
- ✅ Bookmark this page if you operate the AI Kit. Pair it with the Trigger Monitor.
- ✅ Set up an external monitoring system (Prometheus + alerts, an uptime checker, anything) to watch the same metrics over time. The on-screen view is for ad-hoc checks; alerting is for early warnings.
- ✅ Plan disk capacity so that the data volume never goes above 70 % under normal operation.
- ⚠️ The view shows the single server that is currently serving the page. If you run multiple AI Kit instances behind a load balancer, refreshing may show different servers.
- ❌ Do not restart the AI Kit "just to clear memory" without a reason. Restarts interrupt in-flight jobs.
What to do next
- Trigger Monitor — make sure no trigger is misbehaving.
- Security → Local Resources — what lives on the data volume.